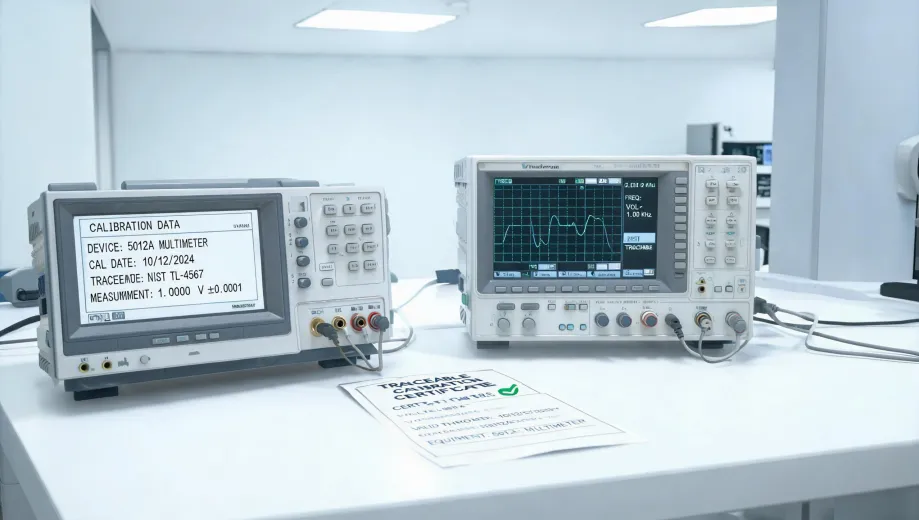
On the first Tuesday of 2024, I was staring at a spreadsheet of sensor readings and wondering where my morning had gone. We’d just finished a quarterly audit of our packaging line’s load cells, and one set was showing a 0.4% drift from the reference standard. Nothing catastrophic, but enough to flag.
We use a National Instruments data logger for most of this work—a CompactDAQ system that feeds straight into LabVIEW. The NI data logger automates the routine stuff: it streams readings, draws the trend lines, and even flags outliers before I can ask. So when my screen said “within tolerance,” I nearly closed the laptop and moved on to the next item.
But something felt off. The drift pattern didn’t look like mechanical wear. It looked systematic—the kind of thing that comes from a bad calibration constant.
The Calibration Sheet That Started It
Here’s the thing: we’d replaced three load cells on that line a few weeks earlier, and the vendor had sent the new units with Rice Lake weighing systems calibration sheets. I knew those sheets contained correction factors, but I hadn’t actually read one in years. In the era of automated data acquisition, the old paper calibration sheet feels like a relic.
I pulled the sheet for the suspect sensor and tried to make sense of the columns. There was the nominal output in mV/V, the zero balance, the input resistance, and—critically—the linearization coefficients for span adjustment. It wasn’t exactly intuitive. One number made me pause: the coefficient listed didn’t match what was stored in our NI data logger’s configuration.
Looking back, I should have checked that sheet before the logger went live. At the time, the digital readout seemed authoritative. Why would I question a $40,000 data acquisition system? I’d even spent part of that morning in the National Instruments download center, grabbing the latest driver update, so I was feeling pretty good about our setup.
Reading the Rice Lake Sheet
If you’ve never seen one of these, the Rice Lake calibration sheet is a table of factory measurements. It gives you:
- Zero return: the sensor’s output with no load applied.
- Output at rated capacity: the millivolt-per-volt signal at full load.
- Input/output resistance: check these with a multimeter to confirm the bridge is intact.
- Calibration coefficients: the values used to adjust the linearity curve.
The last column was the problem. Our system had the sensor’s linearization coefficient set to 1.0000, but the calibration sheet specified 1.0038. That 0.38% difference was exactly the drift we were seeing.
I didn’t trust the paper at first. So I grabbed a digital multimeter with good probes—the ones with low thermal EMF and proper lead compensation—and measured the bridge resistance. Then I used our CMM (coordinate measuring machine) to check the physical mounting geometry, just to rule out mechanical stress. Yes, a CMM machine for load cells. It’s not overkill if you’ve had unexplained drift before.
Every physical check said the sensor was fine. The problem was in the digital configuration, not the hardware.
The Missing Coefficient
The vendor’s factory calibration was newer than the data logger’s configuration. When the sensor was installed, nobody compared the printed sheet against the LabVIEW settings. The NI data logger faithfully recorded the wrong number because it had been given the wrong starting point.
I still kick myself for that. If I’d added a simple verification step when we swapped those load cells, we would have caught the mismatch in ten minutes. Instead, it took an afternoon of troubleshooting, a re-calibration run, and a stressful review of every other sensor on the line.
What This Taught Me
I’m a big believer in automation. The National Instruments download portal is almost always open in my browser, and I trust our data logger’s precision far more than my eyesight for repetitive measurements. But the 2024 incident reminded me that every automated system inherits assumptions from the humans who configure it.
Over four years of running these audits, I’ve learned that the digital readout is only as good as the data you feed it. The fundamentals of measurement haven’t changed: you still need traceable calibration, correct bridge excitation, and clean wiring. What’s changed is the tooling around those fundamentals—data loggers, automated audits, digital config files. The humble calibration sheet still holds the ground truth.
So if you’re wondering how to read a Rice Lake weighing systems calibration sheet, don’t assume it’s obsolete. It’s the manual behind the machine. And if you’re setting up an NI data logger, take the extra ten minutes to cross-check its settings against those paper values. Sometimes the best tool in a quality lab is a skeptical eye.